User Guide/Appendix/Frequency Axis Conversion: Difference between revisions
m (1 revision: Initial import) |
No edit summary |
||
| (3 intermediate revisions by 2 users not shown) | |||
| Line 1: | Line 1: | ||
{{DISPLAYTITLE:{{SUBPAGENAME}}}} | {{DISPLAYTITLE:{{SUBPAGENAME}}}} | ||
{{Appendix}} | |||
{{STX}} uses linear frequency scaling and log amplitude on all amplitude spectrum and spectrogram displays by default. Many technical applications request log base 2 frequency scaling, whereas psychoacoustic analysis uses Bark, ERB (Equivalent Rectangular Bandwidth) and mel frequency conversion optionally. Bark and ERB are empirical scales based on the psychoacoustic phenomenon of Critical Bands, mel represents the psychoacoustic ratio scale of pitch. The following approximation formulae are applied: | |||
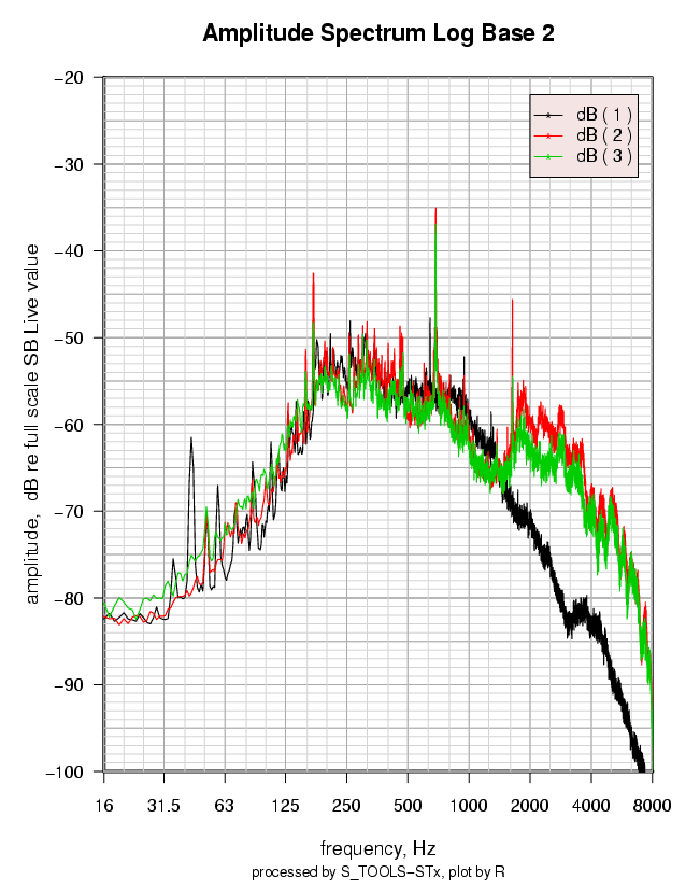
'''Log base 2''' | '''Log base 2''' | ||
Some applications require standardised scaling of amplitude spectra including printout. Windows usually does not supply accurate size and scaling on different printers. For that reason it is suggested to use Postscript format. | Some applications require standardised scaling of amplitude spectra including printout. Windows usually does not supply accurate size and scaling on different printers. For that reason it is suggested to use Postscript format. {{STX}} supports accurate sized printouts via "R" and Adobe. | ||
[[File:629.png]] | [[File:629.png]] | ||
Latest revision as of 15:03, 7 September 2015
STx uses linear frequency scaling and log amplitude on all amplitude spectrum and spectrogram displays by default. Many technical applications request log base 2 frequency scaling, whereas psychoacoustic analysis uses Bark, ERB (Equivalent Rectangular Bandwidth) and mel frequency conversion optionally. Bark and ERB are empirical scales based on the psychoacoustic phenomenon of Critical Bands, mel represents the psychoacoustic ratio scale of pitch. The following approximation formulae are applied:
Log base 2
Some applications require standardised scaling of amplitude spectra including printout. Windows usually does not supply accurate size and scaling on different printers. For that reason it is suggested to use Postscript format. STx supports accurate sized printouts via "R" and Adobe.
Figure 69: Standardised Log base 2 amplitude spectrum plots require proper scaling: 2 mm / dB and 5 mm / 1/3 octave.Frequency in Hz to Bark and ERB
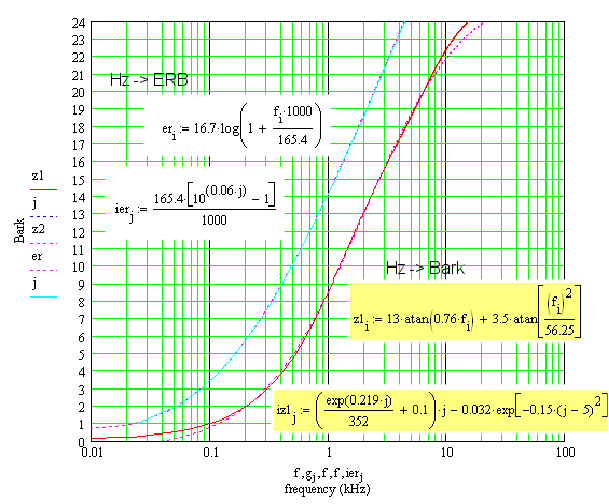
The Bark scale (named according to Heinrich Barkhausen, a german physicist) originates from the Critical Band as an empirical phenomenon in audition. Critical Bands relate to many psychoacoustic functions such as loudness perception, pitch, masking, noise, musical consonance, speech etc. The critical band (CB) is that bandwidth of sounds at which subjective responses change abruptly (for a comprehensive description of the concept of CB see B. Scharf, 1970, p. 159ff). It is worth noting that converting the frequency axis corresponding to critical bands brings spectrograms and amplitude spectra close to the psychophysical spacing of the frequencies in the human inner ear.
Figure 70: Graphs of the frequency conversions Hz / Bark and Hz / ERB (Equivalent Rectangular Bandwidth of Bark) forward and inverted. Parameter: fi in kHz, j = 1,2...25 (Index of Bark).Frequency in Hz and Pitch in Mels
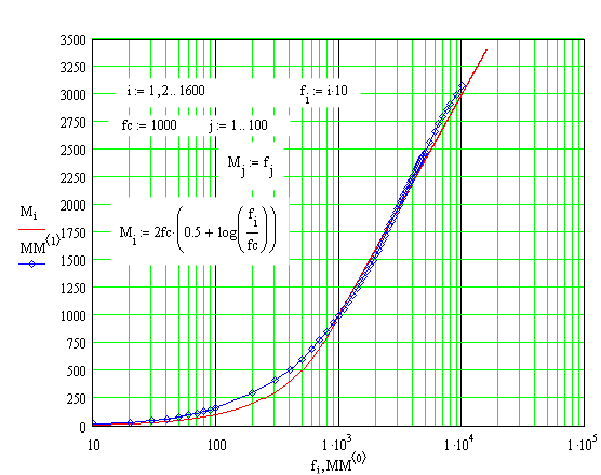
The subjective height of tones in mels constitutes a ratio scale of apparent pitch generated by the psychoacoustic method of fractionation (bisection, equisection) The pitch of a 1000-Hertz tone, 40 decibels above threshold (40 dB Sensation level, SL), is defined as 1000 mels (the standard). The pitch of a tone which is judged by subjects half high as the 1000 mel tone has 500 mels, as twice high 2000 mels etc.
Figure 71: Frequency to mel conversion; blue - diamonds (MM) are empirical data according to: S.S. Stevens (1975): Psychophysics. John Wiley & Sons, Inc. (Appendix 8), red line (Mi): approximation formula.Note: The pitch scale in mels is based on human judgement of pitch ratios. It is different from the musical scale which is essentially a logarithmic scale of frequency (see Musical Intervals in Cents).


