User Guide/Spectrum Viewer/Settings: Difference between revisions
No edit summary |
|||
| Line 42: | Line 42: | ||
Note: If multiple source signals are selected, only the number of selected signals (on the left side) and the Chn.-selection is displayed, the Set- and Seg-controls are hidden. | Note: If multiple source signals are selected, only the number of selected signals (on the left side) and the Chn.-selection is displayed, the Set- and Seg-controls are hidden. | ||
=====enable batchmode===== | |||
If checked, the analysis application is closed automatically when finished. This option can only be used if automatic printout and/or automatic spectrum save is enabled. | |||
=====Automatic Printout===== | |||
If checked, the printout of the waveform plot is started automatically and the application is closed when the printout is finished. The button starts the print settings dialog. | |||
=====do not print cursor===== | |||
If checked, the cursors are not printed. This option works only for the automatic printout. | |||
=====automatic spectrum save===== | |||
If checked, the computed spectra are automatically saved. Older versions of same analysis methods computed for the analysed segment are replaced. | |||
=====show x grid, show y grid===== | |||
Enable/disable the grid on the x/y-scales of the graphs. | |||
=====Color Scheme===== | |||
With this button the color scheme settings dialog is opened to select and/or configure the plot colors, line styles and general graphics settings. The selected color scheme is displayed in the button caption. | |||
=====cursor: crosshair===== | |||
Press this button to select the cursor type to be used in the graphs. | |||
=====bind cursor to spectrum===== | |||
If checked, the cursors y-position (amplitude/phase) are bound to function, otherwise the cursors can be moved free. | |||
=====show frq. ratios in cent===== | |||
If checked, frequency ratios (of cursors) are shown in Cent, otherwise they are show as linear ratio (f1/f2). | |||
=====line1, line2===== | |||
Selects the function line style of the 1st and 2nd spectrum displayed in graphs. See color scheme settings for details on line styles. | |||
=====enable one-click range selection===== | |||
If checked, you can set a new cursor range by clicking anywhere in the graph, dragging and letting go. This can make selecting a cursor range very easy. However, if you prefer to be able to change the cursor range only by selecting a cursor and dragging it, please disable this check box. | |||
Revision as of 09:27, 12 October 2015
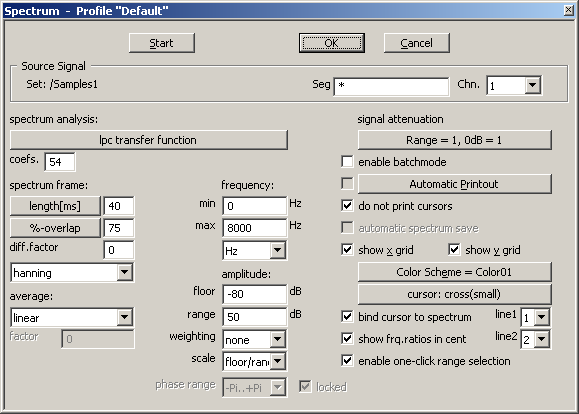
This is the setup and start dialog for the Spectrum Viewer. This application plots averaged spectra of the selected signal computed with one or more methods.
Contents
Dialog Layout
At the top of the dialog window the control buttons and the controls for the source signal selection are located. Below the source signal controls the controls for the application settings are displayed in two groups. On the left side are the settings for the three plot regions zoom, segment lines and overview and on the right side are the general settings and some buttons for sub-dialogs.
Control Buttons
Start
Save settings into the profile displayed in the dialog caption, close the dialog and start the application. This button is only displayed if one or more signals are selected in the Overview or Detail window of the Workspace. If multiple signals are selected, for each signal a separate application is started.
OK
Save settings into the profile displayed in the dialog caption and close the dialog, but do not start the application.
Cancel
Close the dialog without saving the changes.
Note: The Start button is only displayed if a valid object is selected in the Workspace (e.g. a segment or sound file).====Source Signal====
Set:
Shows the XML-reference (IRef) of the audio-set containing the source signal
Seg:
Contains the ID of the selected segment or the address (task-expression) of the source signal. This field can be edited.
Chn.
Source signal channel (All, 1, 2, ...). The contents of the combobox depend on the number of channels of the audio-set.
Note: If multiple source signals are selected, only the number of selected signals (on the left side) and the Chn.-selection is displayed, the Set- and Seg-controls are hidden.
enable batchmode
If checked, the analysis application is closed automatically when finished. This option can only be used if automatic printout and/or automatic spectrum save is enabled.
Automatic Printout
If checked, the printout of the waveform plot is started automatically and the application is closed when the printout is finished. The button starts the print settings dialog.
do not print cursor
If checked, the cursors are not printed. This option works only for the automatic printout.
automatic spectrum save
If checked, the computed spectra are automatically saved. Older versions of same analysis methods computed for the analysed segment are replaced.
show x grid, show y grid
Enable/disable the grid on the x/y-scales of the graphs.
Color Scheme
With this button the color scheme settings dialog is opened to select and/or configure the plot colors, line styles and general graphics settings. The selected color scheme is displayed in the button caption.
cursor: crosshair
Press this button to select the cursor type to be used in the graphs.
bind cursor to spectrum
If checked, the cursors y-position (amplitude/phase) are bound to function, otherwise the cursors can be moved free.
show frq. ratios in cent
If checked, frequency ratios (of cursors) are shown in Cent, otherwise they are show as linear ratio (f1/f2).
line1, line2
Selects the function line style of the 1st and 2nd spectrum displayed in graphs. See color scheme settings for details on line styles.
enable one-click range selection
If checked, you can set a new cursor range by clicking anywhere in the graph, dragging and letting go. This can make selecting a cursor range very easy. However, if you prefer to be able to change the cursor range only by selecting a cursor and dragging it, please disable this check box.

