User Guide/Spectrogram and Parameter Viewer: Difference between revisions
mNo edit summary |
No edit summary |
||
| Line 5: | Line 5: | ||
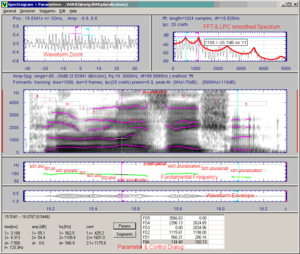
The example below shows the spectrogram with overlaid formant tracks and segment markers, the fundamental frequency track and the waveform of a speech signal. This plot was generated with the default settings of the profile "FFT_Speech". | The example below shows the spectrogram with overlaid formant tracks and segment markers, the fundamental frequency track and the waveform of a speech signal. This plot was generated with the default settings of the profile "FFT_Speech". | ||
[[File:v2_profile_fft_speech.png]] | [[File:v2_profile_fft_speech.png|thumb]] | ||
{| | {| | ||
Revision as of 14:08, 28 August 2015
The application Spectrogram & Parameters Viewer implements spectrogram and parameter analysis methods for mono signals. The application window contains the time synchronous plots of the results of the selected analysis methods, the Sectioner windows and the control dialog (see the settings dialog). The computed parameter functions can be edited and saved in the current DataSet. The Sectioner windows (displayed above all other graphs) , contain the waveform and the spectrum of the signal around the active time scale cursor. The Sectioner also implements functions for spectrum averaging, spectrum statistics and fundamental frequency measurement. For the parameter functions, simple graphical edit and statistic functions are implemented and can be controlled via the control dialog (if the control dialog is not visible, activate using the menu General -> Toggle Dialog).
The example below shows the spectrogram with overlaid formant tracks and segment markers, the fundamental frequency track and the waveform of a speech signal. This plot was generated with the default settings of the profile "FFT_Speech".
<splist parent= sort=asc sortby=title showpath=no liststyle=unordered kidsonly=yes >
