Spectrogram and Parameter Viewer
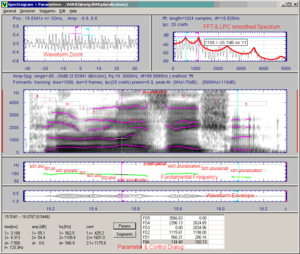
The application Spectrogram & Parameters Viewer implements spectrogram and parameter analysis methods for mono signals. The application window contains the time synchronous plots of the results of the selected analysis methods, the Sectioner windows and the control dialog (see the settings dialog). The computed parameter functions can be edited and saved in the current DataSet. The Sectioner windows (displayed above all other graphs) , contain the waveform and the spectrum of the signal around the active time scale cursor. The Sectioner also implements functions for spectrum averaging, spectrum statistics and fundamental frequency measurement. For the parameter functions, simple graphical edit and statistic functions are implemented and can be controlled via the control dialog (if the control dialog is not visible, activate using the menu General -> Toggle Dialog).
The example below shows the spectrogram with overlaid formant tracks and segment markers, the fundamental frequency track and the waveform of a speech signal. This plot was generated with the default settings of the profile "FFT_Speech".
Contents
Features
Methods
The source signal can be analysed using a multiple of different methods. comes with a set of pre-configured profiles to cover the most common configurations. You can create new profiles with your favourite analysis methods at any time.
Parameters
The parameters calculated by the chosen methods can be individually viewed and edited in the control dialog and graph. Parameters can be copied to the clipboard for exporting to other applications.
Scale Range Auto-Scaling
The best scale range for the analysed signal can now be calculated automatically using the auto-scale feature. The following Spectrogram & Parameters Viewer methods support auto-scaling:
- f0 (harmonic grid)
- formants
- frq.-band signal energy
- signal energy (rms)
- spectrogram
- waveform
In addition, the Sectioner and Spectrum Viewer supports auto-scaling too.
You can turn auto-scaling off for a Viewer's profile using the 'enable zoom and autoscaling' checkbox in the profile's settings dialog. Auto-scaling can then be enabled or disabled for each individual method in its settings dialog. Sectioner auto-scaling is enabled in the Sectioner settings dialog.
Cursors for detailed information mining
There are two cursors available in each graph which can be used to mark sections of the signal on which commands should act, e.g. create a new segment, zoom the graph, listen to a section, edit parameters etc. Information pertaining to the signal at the cursors is displayed in the control dialog.
The Control Dialog
At the bottom of the display, a dialog displays information about the cursors, segments and parameters. This is called the control dialog. You can create segments, annotate and edit parameters here. The dialog can be shown and hidden via the General > Show/Hide Dialog menu.
Hotkeys
A list of hotkeys available in can be found here.
Print or Copy to Clipboard
You can print a copy of the whole display, or of the active graph either by selecting Copy/Print from the context menu or Print from the General menu. The printer settings can be modified via Print Settings in the General menu.
<splist parent= sort=asc sortby=title showpath=no liststyle=unordered kidsonly=yes >
