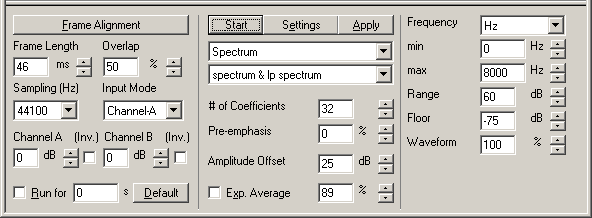
Parameters Dialog
The Real-Time Analyser is provides a large number of parameters for altering the analysis display.
Frame Alignment
The Frame Alignment sets the Frame Length (see below) to the value of the next highest power of two (in samples). This means that optimal frequency resolution can be obtained without loss of computational speed.
Frame Length
The frame length in milliseconds (ms). There is a minimum frame length of 5ms.
Overlap
The overlap (frame shift) in percent between frames. The value can be between 0 and 95.
Sampling (Hz)
The sampling rate in Hertz at which the input signal should be sampled. Note that the lower the sampling rate, the smaller the frequency scale can be (i.e. the maximum frequency is the srate/2).
Input Mode
The input mode defines how the input signal is displayed.
Channel A / Channel B
Gain in decibels (dB) for channels A and B
(Inv.)
Invert the signal (multiply signal with -1)
Run for
Check the checkbox to activate the Run For feature. You can run the Real-Time Analyser for a specific number of seconds before it automatically stops. A value of 0 means run forever.
Default
The button Default sets the Run For edit box to the length of the time axis of the Real-Time Analyser display.
Start/Stop
Start the analyser. Once started, the button text changes to Stop.
Settings
Frame buffer, color and signal I/O settings dialog box. See the Settings Dialog for the Real-Time Analyser for more details.
Apply
Press the Apply button to apply parameter setting changes. Note that some parameter changes are applied automatically.
Spectrum/Spectrogram/Waterfall
The type of graph to display the analysis with:
There are a number of different analysis methods available in the Real-Time Analyser. The Spectrum graph display can also display a combination of two methods.
Method: spectrum
Computes an FFT amplitude spectrum
Method: cp smoothed spectrum
Computes the averaged cepstrum smoothed amplitude spectrum, via the inverse transform of the lowpass filtered cepstrum.
Method: lp spectrum
Compute the averaged transfer function (amplitude) using the LPC auto-correlation method.
# of Coefficients
The number of coefficients used for the computation of the cp smoothed spectrum or lp spectrum.
Pre-emphasis
Signal differentiation factor in percent. 0 to 100% are valid values.
Amplitude Offset
The amplitude offset between the two methods (only available for combined methods in the Spectrum graph).
Exp. Average
Check the checkbox to activate the exponential averaging. Values from 0 to 99% are valid.
Frequency
The frequency unit to use for the frequency axis.
min/max
The minimum and maximum frequency to display. Note that the validity of the values are dependant on the sampling rate.
Range
The amplitude range to display.
Floor
The lowest end of the amplitude range.
Waveform
Percentage of full attenuation to display.
x-axis / y-axis
Only available if the Waterfall graph display is being used. The x-axis determines what percentage of the graph's width should be used for the x axis. Possible values are -100 to 100%. A negative value means that the x-axis is bound to the right hand side of the display.
