Waveform and Segmentation Viewer
The Waveform Plot & Segmentation Viewer plots the waveform of the selected signal and is most often used to segment sound files. In STx 5.0.0, basic signal editing capabilities were added.
The Transcription Script is a more recent alternative for segmentation.
Contents
Overview Graph
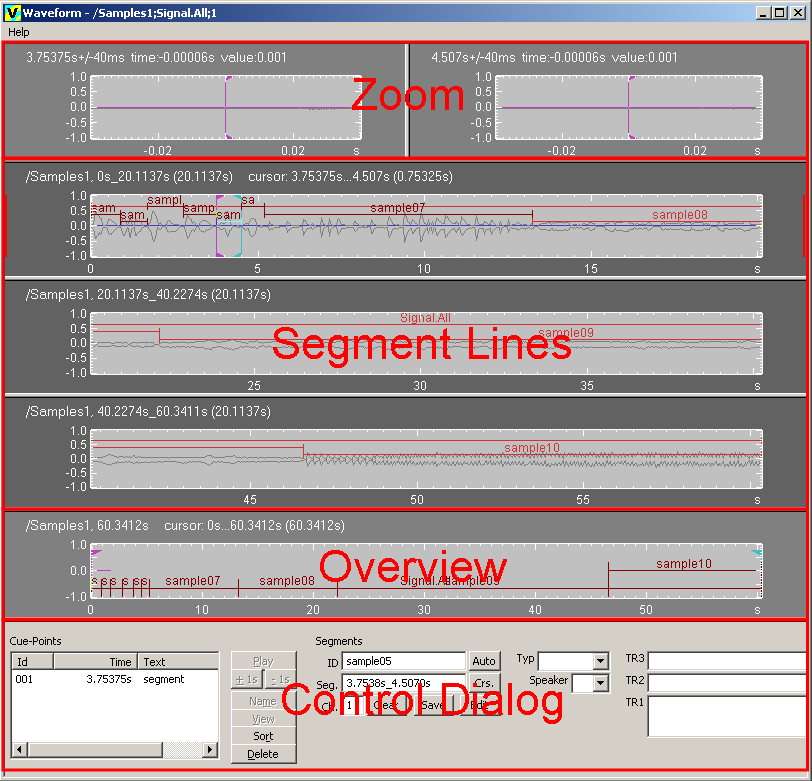
The overview contains the signal of the whole audio set (sound file or sequence). The overview graph can contain the waveform or only the time-scale. This region can be enabled/disabled. The overview plot contains two cursors which can be used for segmentation or to select the signal for playback or for viewing in the segment lines region. The overview line optionally contains segment markers. Warning: For large sound files with many segments, the time for segment marker display/update can be very long, and using the Transcription Script may be advisable.
Segment Line Graphs
The segment lines contain the signal of the source signal segment (on started) or the signal between the overview cursors. The signal can be displayed in one or more lines. If the number of lines is greater than 1, the displayed signal is split into parts of same length. The segment lines plot contains two cursors which can be used for segmentation or to select the signal for playback or for viewing in the zoom region (zoom mode "between cursors"). The segment lines plot optionally contains segment markers. Warning: If the displayed signal range contains many segments, the time for segment marker display/update can be very long.
Zoom Graphs
The zoom graphs display a detailed version of the signal marked by the cursors in the segment line graphs. The zoom graphs display different signals, depending on the cursor mode settings:
- The signal around the active cursor is zoomed (one zoom graph).
- The signal around both cursors is zoomed (two zoom graphs).
- The signal between the cursors is zoomed (one zoom graph).
In cases 1 and 2, the zoom graphs are updated automatically, and only one cursor per zoom window is displayed. Here the cursors can be used to correct the position of the segment line cursors.
In case 3, the user controls the zoom window update, and there are two cursors in the zoom window, which can be used for segmentation and playback.
The zoom region can be enabled or disabled in the settings dialog or the zoom graph's setup dialog (context menu in a zoom graph).
Control Dialog
The control dialog of this application contains controls to create and/or modify segments. The picture above shows the viewer with a visible control dialog, an overview timebar (no waveform), one segment lines with segment markers and two zoom windows for the signal around both segment lines cursors. The control dialog can be hidden, shown or moved via the context menu.
The following unsorted topics are currently available:
Waveform and Segmentation Viewer Dialogs
The Waveform & Segmentation Viewer application has various dialogs for settings and parameter modification.
Zooming
Zooming in Waveform & Segmentation Viewer is available on the amplitude axis in the segment line graphs, and on the time and amplitude axes in the zoom graphs.
- See Zooming in a Viewer for general details about zooming.
- See Waveform & Segmentation Viewer hotkeys for a list of available hotkeys
All zoom functionality is available via the context menu too.
Playback
There are a number of playback commands available in Waveform & Segmentation Viewer:
- Play back the signal between the cursors (P)
- Play back the whole signal (Q)
- Play back the signal window (SPACE)
Looping playback
You can turn looped playback on and off with the hotkey L.
Stopping playback
You can stop playback with the hotkey ESC.
Pre-Configured Profiles
The Waveform and Segmentation Viewer comes with the following pre-configured profiles.
- Default
- The default profile, with one line.
- Multiline
- This profile displays the selected signal (segment or sound file) in three rows.
General Settings Dialog
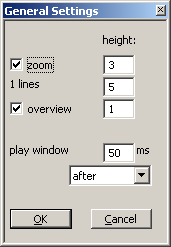
The General Settings dialog modifies the height and visibility of the various regions of the Waveform & Segmentation Viewer application and the play window parameters.
- zoom
- Hide / show zoom window(s)
- overview
- Hide show overview window
- height
- The three lines below this text are the relative height of the zoom, segment lines and overview regions.
- play window
- Play window length and alignment. The play window is activated using the SPACE bar in the Zoom windows.
This dialog is available via the Waveform & Segmentation Viewer context menu.
Segment Markers Dialog
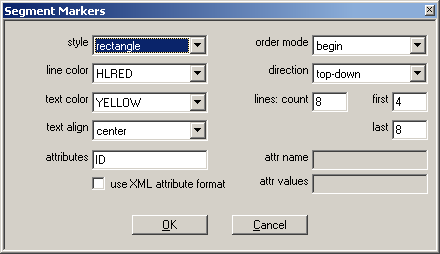
The Segment Markers Dialog controls the way segments are displayed in a particular graph. You can specify the shape and color, as well as the text alignment. You can also split the graph into lines and specify the lines in which segments should be displayed. You can even filter the visible segments based on an attribute and value combination.
Each profile method has its own segment marker settings.
- style
- Selects the style of the graphics object used for the marker.
- line color
- Color used to draw and optional fill the marker object.
- text color, text alignment
- Color and alignment for text displayed in the marker.
- attributes
- List of blank separated segment attributes to be displayed in the marker. At least one attribute name must be entered. Attribute names are case sensitive! The attributes are displayed in the same order they are specified.
- use XML attribute format
- If checked, the attributes are displayed in the format name="value", otherwise only the attribute value is displayed.
- order mode
- Selects the method with which segment markers should be sorted.
- direction
- Selects the order in which segment markers are assigned to the segment lines.
- count
- The number of segment lines in the graph. The higher the number, the smaller the segment height.
- first
- The first line to use for drawing segments. Usually 1.
- last
- The last line to draw segments on. If the same as 'count', then segments will use the full height of the graph. If, e.g., count/2, then only half of the graph's y axis will be used. The 'last' value is only used if 'order mode' is set to begin or ID.
- attr name, attr values
- The field attr name contains the name of the attribute to be used to assign segments to lines. The field attr values contains the list of values in the marker line order. Both fields are only used for the order mode attribute-value.
Examples
If you are using the webMAUS interface, then you will receive segments with the attribute 'Tier' and the attribute values 'ORT-MAU', 'KAN-MAU' and 'MAU'. If you would like to draw one Tier per line, then set the 'order mode' to 'attribute-value', the 'attr name' to 'Tier' and the 'attr values' to 'ORT-MAU KAN-MAU MAU'.
Profile Settings Dialog
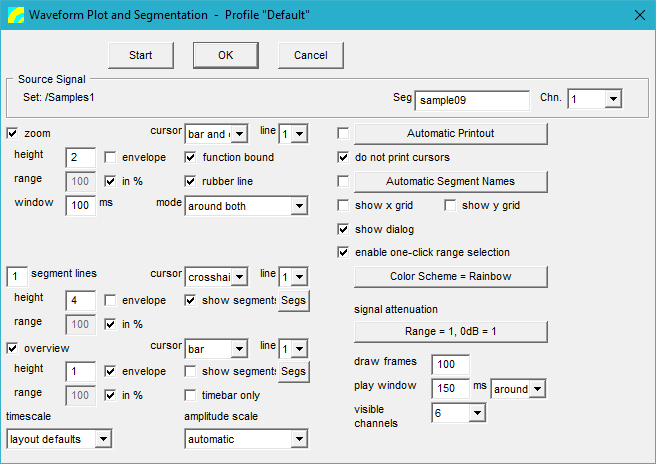
This is the setup and start dialog for the Waveform & Segmentation Viewer application. You reach this dialog by selecting a Waveform & Segmentation Viewer profile in the Workspace and selecting 'Settings' from the context menu.
Dialog Layout
At the top of the dialog window the control buttons and the controls for the source signal selection are located. Below the source signal controls the controls for the application settings are displayed in two groups. On the left side are the settings for the three plot regions zoom, segment lines and overview and on the right side are the general settings and some buttons for sub-dialogs.
Control Buttons
- Start
- Save settings into the profile displayed in the dialog caption, close the dialog and start the application. This button is only displayed if one or more signals are selected in the Overview or Detail window of the Workspace. If multiple signals are selected, for each signal a separate application is started.
- OK
- Save settings into the profile displayed in the dialog caption and close the dialog, but do not start the application.
- Cancel
- Close the dialog without saving the changes. Note: The Start button is only displayed if a valid object is selected in the Workspace (e.g. a segment or sound file).
Source Signal
- Set
- Shows the XML-reference (IRef) of the audio-set containing the source signal
- Seg
- Contains the ID of the selected segment or the address (task-expression) of the source signal. This field can be edited.
- Chn.
- Source signal channel (All, 1, 2, ...). The contents of the combobox depend on the number of channels of the audio-set. Note: If multiple source signals are selected, only the number of selected signals (on the left side) and the Chn.-selection is displayed, the Set- and Seg-controls are hidden.
Zoom Settings
The zoom graphs shows the signal around or between the cursors of the segment lines graphs.
- zoom
- Show (check) or hide (not checked) the zoom window(s).
- height
- Set the relative height of zoom region. Note that this can also be set in the General Settings dialog.
- range
- Range of amplitude-scale of the zoom window(s). If the in % box is checked the range is specified in percent of the full range value (see General Settings), otherwise range is an absolute signal amplitude value. The value of this field must be greater than zero. The amplitude-scale of the zoom window is scaled from –range to +range.
- envelope
- If checked, only the envelope of the waveform is displayed, otherwise the waveform function is filled.
- window
- Length of the signal displayed in the zoom window in milliseconds. This value is used for zoom-windows displaying the mode around-active. In this case the time-scale of the zoom-window is scaled from –window/2 to +window/2.
- cursor
- Selects the cursor style
- function bound
- If checked, the Y-position (amplitude) of the cursors are bound to the waveform function, otherwise the cursor can be moved free.
- rubber line
- If checked, a rubber line is drawn between the two cursors
- line
- Selects the function line style and color for the zoom window waveform function (see Color Schemes)
- mode
- This field selects one of three available zoom modes: between-cursors (one zoom window containing the signal between the two segment lines cursors), around-active (one zoom window containing the signal around the active/selected segment lines cursor) or around-both (two zoom windows each containing the signal around one cursor of the segment lines region).
Segment Lines Settings
- lines
- Number of display lines for waveform of source segment. This number must be in the range 1 to 8.
- height, envelope, range, in %, cursor, line
- See zoom settings.
- show segments
- If checked, the segment markers for all segments in the range of the signal plotted in the segment lines graphs are shown. The marker format and style and the displayed text are configured in the segment markers dialog which can be opened with the button Segs.
- Segs
- Open the segment marker settings dialog.
Overview Settings
- timebar only
- If checked, only the time scale is displayed but the signal waveform is not plotted. This can be useful if the sound file is very long, since plotting a long file takes time.
For the other settings read the description of the settings for segment lines and zoom.
General Settings
- Automatic Printout
- If checked, the printout of the waveform plot is started automatically and the application is closed when the printout is finished. The button starts the print settings dialog.
- do not print cursor
- If checked, the cursors are not printed. This option only works for the automatic printout.
- Automatic Segment Names
- If checked, the id of new segments is assigned automatically. The format of the automatic name depends on the settings of the Automatic Segment Names dialog, which can be opened with this button.
- show x grid, show y grid
- Enable/disable the grid on the x/y-scales of the waveform plot.
- show dialog
- If checked, the control and segmentation dialog of the waveform plot application is shown, otherwise in is hidden.
- enable one-click range selection
- If checked, you can set a new cursor range by clicking anywhere in the graph, dragging and letting go. This can make selecting a cursor range very easy. However, if you prefer to be able to change the cursor range only by selecting a cursor and dragging it, please disable this check box.
- Color Scheme
- With this button the Color Scheme and Settings dialog is opened to select and/or configure the plot colors, line styles and general graphics settings. The selected color scheme is displayed in the button caption.
- signal attenuation
- The amplitude value of the full signal attenuation. This value must be greater than zero.
- draw frames
- Number of frames (blocks) to be used for plotting long signals. This number is set to 100 by default and must be greater than 2. It can be used to optimize the graphics transfer rate. Normally it need not to be changed.
- play window
- Set length (in milliseconds, greater than 0) and position (before/after selected cursor) of the play window. The waveform plot application plays the signal of the play window, when the space-bar is pressed.
- timescale
- Select which unit should be used for the time axis (x axis). If 'layout defaults' is specified, the settings defined in the Display Layout and Format dialog are used.
- amplitude scale
- If set to 'automatic', the optimal amplitude scale based on the selected signal is used, otherwise the graph's 'range' settings are used.
Segments Dialog
The segments dialog is displayed on the right side of the control dialog.
It consists of a fixed part (the segment definition and the buttons) and a user defined part (the segment attributes). The controls for the attributes (in the example: Typ, Speaker, TR1, TR2) are defined in the associated audio segment template.
- ID
- The ID (name) of the selected / new segment.
- Auto
- Copy the next automatic segment name into field ID. The name format can be configured with the automatic segment names dialog.
- Seg.
- Position and length (task expression) of the selected / new segment.
- Crs.
- Use the position of the current cursor(s) to update the Seg. field.
- Ch.
- Channel attribute value of the selected / new segment.
- Clear
- Reset all segment attributes to default / empty values.
- Save
- Save segment attributes. If a marker is selected, the segment is updated, otherwise a new segment is created.
- Edit
- Save segment attributes and display the segment properties dialog (without dialog-template).
- Typ, Speaker, TR1, TR2
- Controls containing the user defined attributes of the selected / new segment. The controls for the attributes (in the example: Typ, Speaker, TR1, TR2) are defined in the associated audio segment template. The fields ID, Seg., Ch. and the attribute fields are updated automatically when a segment marker is selected.
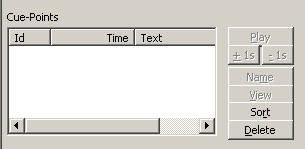
Cue-Points Dialog
Cue-points are saved cursor positions. They can be useful for quickly marking positions in a signal whilst listening. The cue-points can then be used for segmentation, playback and viewing the signal in the segment lines. Note that they are neither saved (in the project or in the viewer settings) nor displayed (as segments) in the waveform graphs.
In the Waveform & Segmentation Viewer application, the cue-points dialog is displayed on the left side of the control dialog. In each waveform graph the Set Cue-Point function (context menu or hotkey) can be used to add a cue-point to the list.
- Cue-Points
- List of defined cue-points. For each cue-point the list contains the automatically assigned Id, the position (Time) and the name of the source region (Text: zoom, segment or overview).
- Play
- Plays the signal between two selected cue-points.
- +1s, -1s
- Plays one second of the signal after/before the selected cue-point.
- Name
- Creates a segment over the signal between two selected cue-points. This segment is stored in the DataSet.
- Sort
- Sorts the cue-point list. The column header buttons of the list can also be used to sort the cue-point list by the values of the selected row.
- Delete
- Delete the selected cue-points.
